 to view the data in a grid. From here, you can filter, sort and customize
the grid.
 The Site Merge Tool allows you to merge any data object and field available in the Student Selector with the ability to apply filters for any field. You can then analyze the data using the Pivot Grid by selecting fields as the rows and columns. The Pivot Grid will summarize the results of the rows and columns. You can then chart the results of the Pivot Grid into a pie or bar-graph chart.
Click the Options Menu, Site Tools, Data Object Merge Tool.
The Site Merge Tool screen will appear.
Select the student(s) to view.
To view documentation on the Student Selector, click here.
Click  to view the data in a grid. From here, you can filter, sort and customize
the grid.
To view documentation on How to Filter a Grid, click here.
To view documentation on How to Sort and Group a Grid, click here.
To view documentation on How to Customize a Grid, click here.
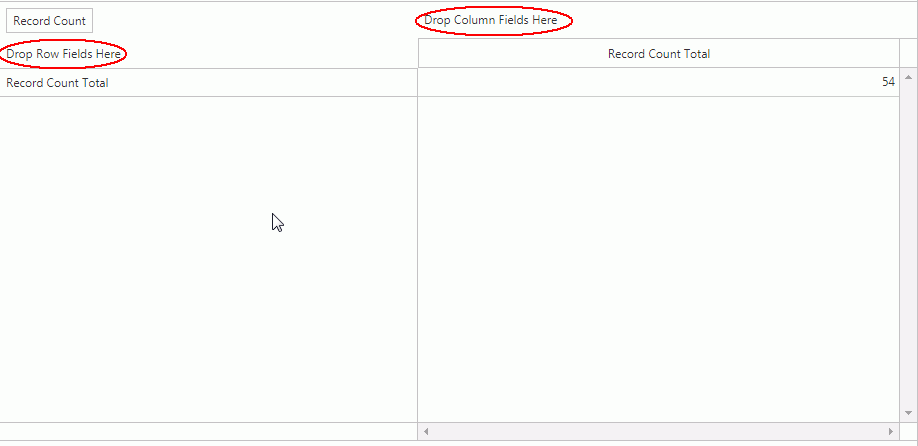
Click  to load the data into the Pivot Grid. Under the Data Tab
  , you can organize the data
to your specifications by dragging and dropping the data objects into
the Row Fields or the Column Fields.

After you have organized the data, use the
Chart Tab  to view the data in a Pie/Bar Chart.
Please refer to the Data Object Merge Tool video for further instruction.